Img2GPS: Predicting GPS Coordinates from Images
Team Members: Vineet Pasumarti, Adam Peles, Michael Imevbore
This project aimed to build a computer vision model capable of predicting the geographic coordinates (latitude and longitude) of ego-centric images taken in the Engineering Quad at the University of Pennsylvania. We first constructed a diverse dataset of 741 images under varying weather and lighting conditions. We then conducted an ablation study varying model depth, learning rate, and batch size to identify the optimal configuration. The results demonstrated that ResNet-18 with a batch size of 16 and a learning rate of 0.001 yielded the best validation RMSE, while deeper models acting on the same dataset and hyperparameters actually introduced greater bias and underperformed in both training and validation sets.
Data Collection and Dataset
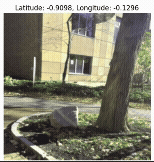
We manually collected images around the engineering quad (bounded by Walnut, Spruce, 33rd, and 34th Streets). To ensure variability, photos were taken at different angles, times of day, and in diverse weather (including rain). The final dataset included 741 labeled images. EXIF metadata provided GPS labels, and images were resized to 224x224. We allocated 60 images for validation, training on the remaining 681.
Model Design
We began with a ResNet-18 baseline and experimented with ResNet-50 to capture deeper spatial features. Multiple hyperparameters were tested. The best configuration used ResNet-18 with a training batch size of 16, learning rate 0.001, Adam optimizer, and a scheduler (step size=5, gamma=0.1). ResNet-18’s simplicity proved advantageous given our limited dataset. In contrast, ResNet-50 struggled to converge effectively due to its higher parameter count and increased optimization difficulty, which require substantially more data to generalize and train efficiently.
Evaluation and Model Performance
Evaluation was done using RMSE on a held-out validation set of 60 images. Training and validation MSE were tracked across epochs. The best performing model reached an RMSE of 68.78 on validation and 65.97 on the test set.
Learning Rate and Batch Size
How can we exploit the relationship between learning rate and batch size to train a model that generalizes well on an image dataset?
The loss landscape of high-dimensional feature spaces is bound to have many local minima that deter gradient descent from easily reaching a global minimum. To ensure performance on the test dataset, our model must learn meaningful parameters during training that facilitate effective generalization on unseen data. Therefore, we should enhance the fine-tuning process by exploiting the relationship between learning rate and batch size.
Our intuition entering this project was to retain a small batch size to boost the stochastic nature of mini-batch gradient descent. In doing so, we hypothesized that the noise associated with using a small batch size will help traverse through saddle points and local minima in the loss landscape. Despite our motivation to increase stochasticity, we avoided pure stochastic gradient descent on the premise that it is too inefficient and will take much longer to train on our GPU.
Recent theory suggests that the learning rate should be multiplied by k when using large mini-batches of size kN [2]. 3 years prior to this work, Alex Krizhevsky provided evidence that learning rate should actually be multiplied by the square root of k when multiplying batch size by k. By doing so, the variance in the gradient expectation remains constant[3]. We began our fine-tuning process with a batch size of 8 – a quarter of the default batch size (32) provided by the baseline model. This implied that our initial learning rate of 0.001 should be halved to 0.0005. However, we approached this recommendation with caution, given that 0.001 is already considered small. Ultimately, we determined that the existing learning rate scheduler would naturally decrease the learning rate to an adequately small value by the time of convergence, thus justifying our decision to maintain 0.001 as the initial learning rate.
We also believed that a relatively larger initial learning rate will help overcome saddle points and local minima. Our intuition was that the noise of a small batch size may produce a gradient that will help overcome local minima; however, a very small learning rate will lead to a minuscule step, and therefore would not suffice to escape local minima and saddle points. Although we decided on 0.001 as our initial learning rate, we chose to try larger learning rates like 0.003 and 0.005 in the fine-tuning process.
| Learning Rate | BS 8 | BS 16 | BS 32 |
|---|---|---|---|
| 0.001 | 79.89 | 68.78 | 70.12 |
| 0.003 | 91.42 | 91.79 | 92.63 |
| 0.005 | - | 93.61 | 93.39 |
According to our results, the optimal learning rate was 0.001. We disproved our original hypothesis that a relatively larger learning rate would increase our validation accuracy by providing an adequate step-size to overcome local minima and saddle points in the loss landscape. Instead, as our learning rate increased, the validation accuracy decreased, as shown visually below:
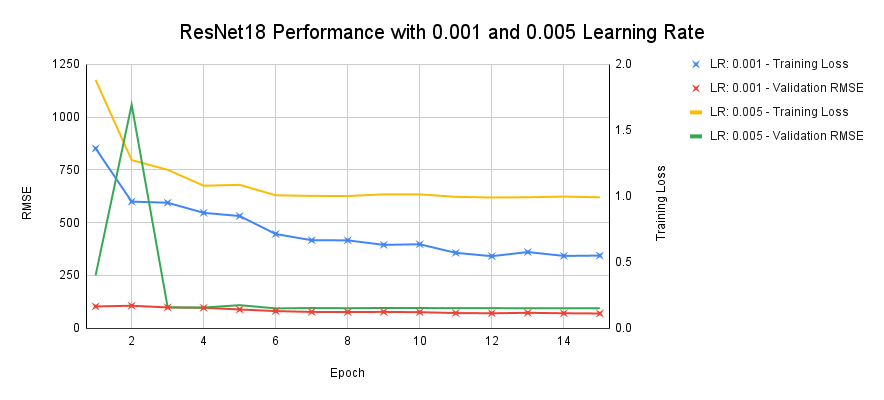
As seen above, the ResNet18 model trained with a learning rate of 0.001 exhibited superior performance on both the training and validation datasets compared to its counterpart trained with a learning rate of 0.005. Both models underwent training for 15 epochs with a batch size of 16 and a validation batch size of 32, and utilized an Adam optimizer and a learning rate scheduler with a step size of 5 and gamma of 0.1. The model trained with a 0.005 learning rate clearly underfits and struggles to achieve the same level of accuracy on the training data as the model trained with a 0.001 learning rate.
Most importantly, we can visually observe how the training loss with a 0.005 learning rate converged at epoch 6 – far sooner than the training loss with a 0.001 learning rate, which converged at approximately epoch 12. This observation strongly validates our classwork as we observed in our own lectures how learning rates that are too large will converge too early and retain a significant bias. We can also conclude that a learning rate of 0.001 is not too small; otherwise we should observe a much higher initial training loss and eventually a point of intersection between both training loss curves where the too-large learning rate is outperformed by the too-small learning rate. Therefore, we can conclude that 0.001 was a strong selection for our ResNet18 model.
ResNet18 vs ResNet50
Although both ResNet18 and ResNet50 are used for image classification, we wanted to see which would perform best and be most generalizable on the validation dataset, especially since our validation dataset is meant to emulate the distribution shift in the test dataset used on the leaderboard. Therefore, having an edge on our validation set should also transfer to high performance on the leaderboard.
ResNet50 is a significantly deeper neural network with 50 layers compared to ResNet18 with only 18 layers. Our belief was that a larger neural network, like ResNet50, would learn to put more weight on consistent landmarks like trees and buildings over cars or people, and therefore perform better on our validation set. This is because of the inherent nonlinearity of a neural network, so the increase in layers also means an increase in features and parameters; this allows the model to learn more effectively given a complicated input dataset like that of images. Additionally, the bias-variance trade-off suggests that we may overfit the training data due to the complexity of the deeper neural network. When comparing ResNet18, ResNet50, and ResNet101 in existing literature, we see that “deeper ResNets, such as ResNet-50 and ResNet-101, achieve better results compared to their shallower counterparts”[1] for visual geo-localization. Additionally, “ResNet-50 provides a good trade-off between accuracy, FLOPs and model size”, while “ResNet-18 allows for much faster and lighter computation, making it the most efficient, lightweight backbone despite performing worse”[1]. Based on this article and our prior knowledge, we would expect ResNet50 to achieve better GPS coordinate prediction accuracy due to its deeper architecture allowing for more complex feature extraction. We expect ResNet18 to show faster training and inference times but potentially higher prediction error.
To compare the performance of ResNet18 v ResNet50, we hold all hyperparameters constant and plot the training loss and validation RMSE curves to visually compare the rate of convergence and final loss at convergence. We also plot latitude vs longitude for predictions and labels to visually see clustering that imply bias. Our hyperparameter selection followed the test matrix shown above in Table 1.
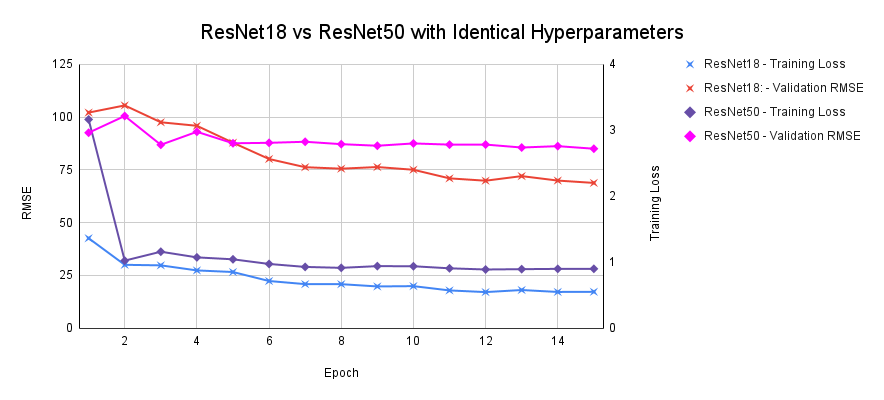
According to our data, ResNet18 actually performed better than ResNet50 in correctly predicting GPS locations. Both training loss and validation RMSE for ResNet18 were lower in all of our hyperparam- eter combinations. Additionally, ResNet18 consistently saw less bias in latitude and longitude plots compared to ResNet50. This defied our initial beliefs in two major ways. One, we expected ResNet50 to outperform ResNet18 on the validation dataset. Two, we expected ResNet50 to potentially overfit the training data and induce variance – not more bias. As seen Figure 2 below, the training loss curve for ResNet50 is higher than that of ResNet18 despite reaching convergence around the same time. This is a clear indication of underfitting the training data and therefore increasing bias. We can assert that our ResNet50 model did not adequately learn effective parameters and we believe the culprit is insufficient data.
ResNet50 is a deeper neural network and requires a larger dataset in order to train effectively. Our training set of 681 images, although useful for ResNet18, is not enough data for ResNet50 to generalize over. This argument is also intuitive – for ResNet50 to combat distribution shift by learning features like landmarks and ignoring features like people and cars, it will need a tremendous amount of data that repeatedly showcases important features. In our case, the deeper network has too many parameters to effectively learn from our limited dataset, and therefore failed to capture underlying patterns in the feature space.
Repository: View on HuggingFace